Stocks Bounced Back as Yields Jumped Above 5% and a December Rate Hike Became a Near Certainty
By Guardant Wealth Advisors
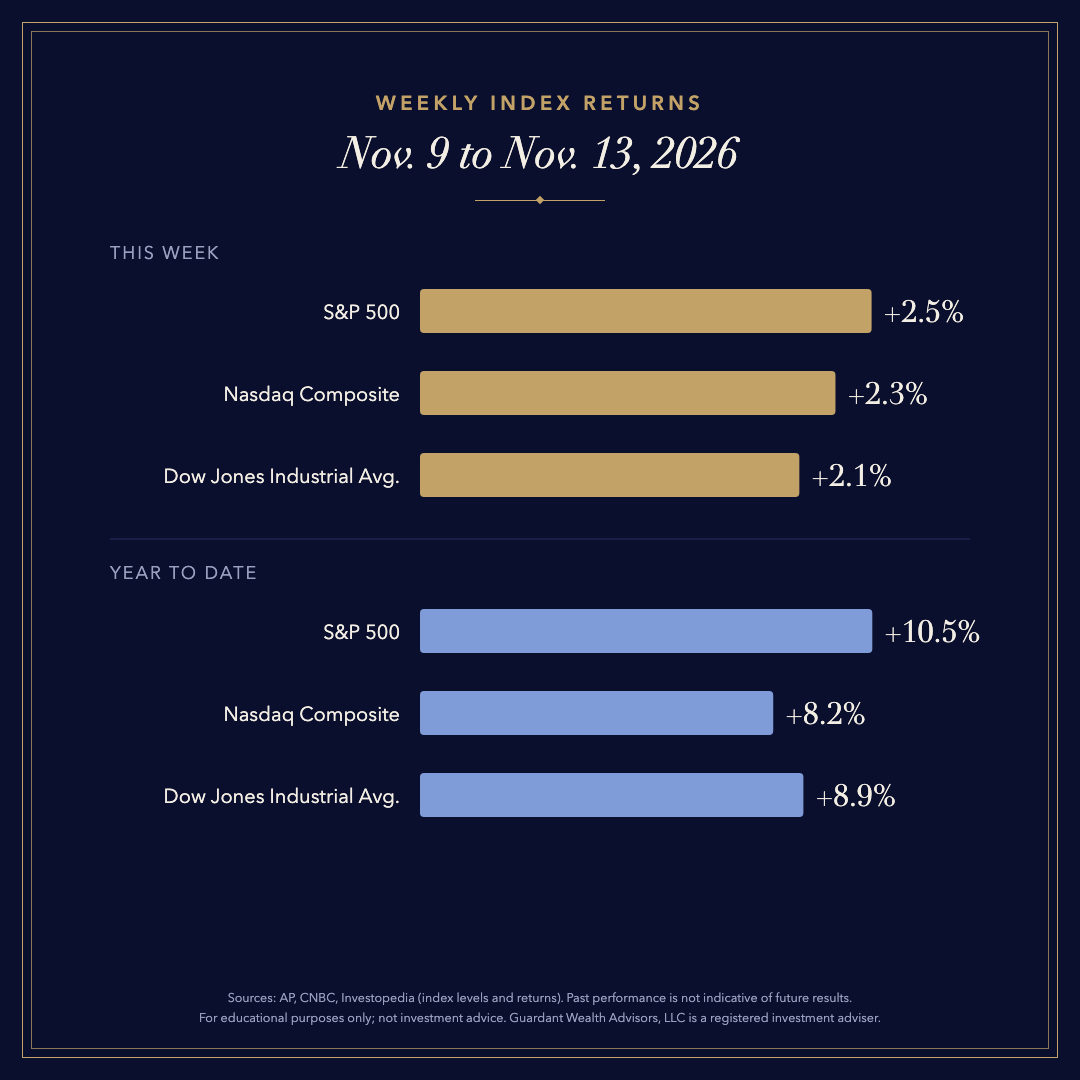
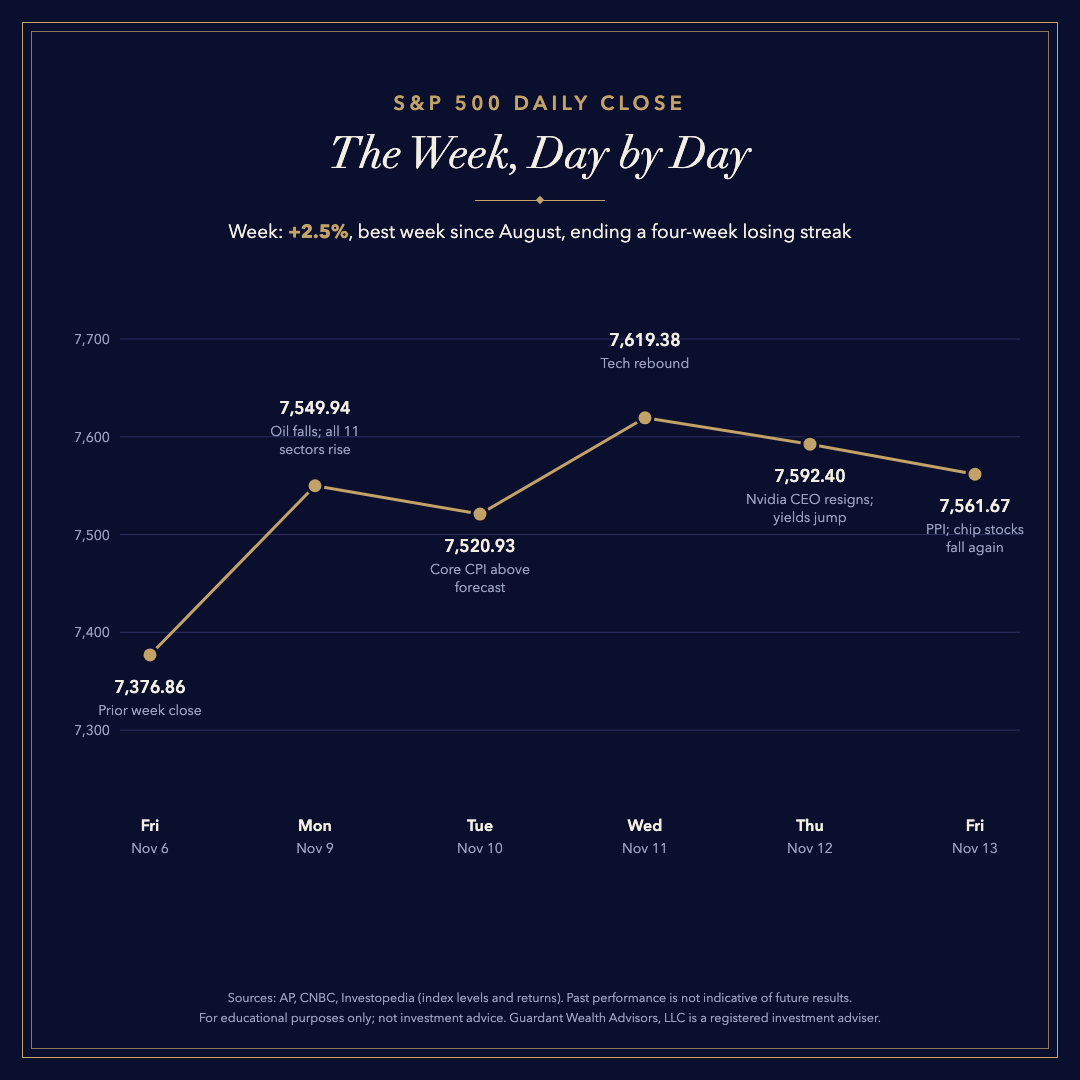
After the prior week’s sharp selloff, markets found their footing. The S&P 500 rose 2.5%, its best week since August, ending a four-week losing streak. The Nasdaq Composite gained 2.3% for its first weekly advance in five weeks, and the Dow Jones Industrial Average added 2.1%. Underneath that recovery, however, the bond market sent a more cautious signal.
What We Observed This Week
- Monday set the tone. Oil prices fell sharply as fears of renewed conflict with Iran eased, and the S&P 500 rose 2.35%, its best day since April, with all 11 sectors gaining.
- Inflation remained stubborn. The Consumer Price Index (CPI) rose 0.4% in October, and core prices, which exclude food and energy, rose 0.3%, above forecasts. Because October 2025 data were never collected during last year’s government shutdown, the Bureau of Labor Statistics (BLS) did not publish a 12-month rate.
- Wholesale prices told a similar story. The Producer Price Index (PPI) rose 0.3% in October and 6.5% over the past 12 months, the largest annual gain since November 2022.
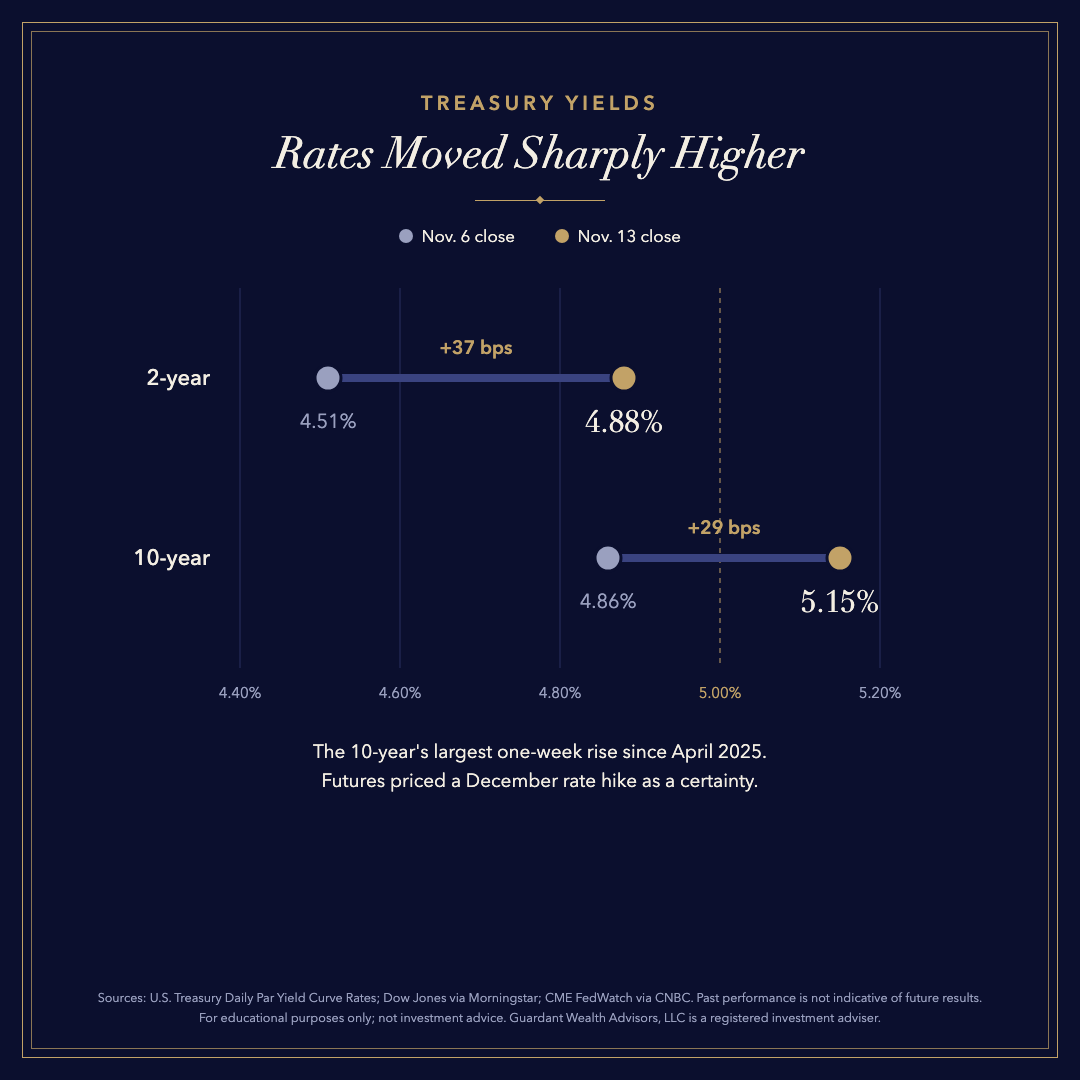
- Bond yields moved sharply higher. The 10-year Treasury yield climbed from 4.86% to 5.15%, and the 2-year yield rose from 4.51% to 4.88%. For the 10-year, it was the largest one-week increase since April 2025.
- Rate expectations shifted. By Friday, CME FedWatch data showed futures markets pricing a December rate hike as a certainty, with most of the debate centered on whether it would be a quarter point or a half point.
- Company news added volatility. Nvidia announced on Thursday that its co-founder and chief executive had resigned, and its shares fell as much as 14% before closing down about 4%. Chip stocks weakened again on Friday.
- Oil ended lower. Brent crude settled at $95.84 a barrel, down about 2.5% for the week.
What We Are Watching
- The Federal Open Market Committee (FOMC) meeting on December 8-9 and any signals about how many additional increases policymakers may consider.
- Whether the 10-year yield holds above 5%, which may influence mortgage rates, corporate borrowing costs and stock valuations.
- Nvidia’s quarterly results on November 17, a closely watched report for the broader artificial intelligence (AI) trade.
- November CPI on December 10, the next major read on whether inflation pressures are easing.
The Long-Term Takeaway
Weeks like this one show that stock prices and interest rates do not always move in the same direction for the same reasons. Equities recovered on lower oil prices and improved sentiment, while bond markets focused on persistent inflation and a likely tighter Federal Reserve. We believe that keeping both perspectives in view, and maintaining a diversified portfolio aligned with long-term goals, may help investors navigate periods when markets send mixed signals.
This content is for educational purposes only and does not constitute personalized investment advice or a recommendation to buy or sell any security. The information provided reflects general market commentary based on publicly available information and is not tailored to the financial situation of any individual. Investing involves risk, including the possible loss of principal. Past market performance is not indicative of future results. Guardant Wealth Advisors, LLC is a registered investment adviser. Registration does not imply a certain level of skill or training.

Weekly Market Commentary: November 9 – 13, 2026
Stocks Bounced Back as Yields Jumped Above 5% and a December Rate Hike Became a Near Certainty
By Guardant Wealth Advisors
After the prior week’s sharp selloff, markets found their footing. The S&P 500 rose 2.5%, its best week since August, ending a four-week losing streak. The Nasdaq Composite gained 2.3% for its first weekly advance in five weeks, and the Dow Jones Industrial Average added 2.1%. Underneath that recovery, however, the bond market sent a more cautious signal.
What We Observed This Week
What We Are Watching
The Long-Term Takeaway
Weeks like this one show that stock prices and interest rates do not always move in the same direction for the same reasons. Equities recovered on lower oil prices and improved sentiment, while bond markets focused on persistent inflation and a likely tighter Federal Reserve. We believe that keeping both perspectives in view, and maintaining a diversified portfolio aligned with long-term goals, may help investors navigate periods when markets send mixed signals.
This content is for educational purposes only and does not constitute personalized investment advice or a recommendation to buy or sell any security. The information provided reflects general market commentary based on publicly available information and is not tailored to the financial situation of any individual. Investing involves risk, including the possible loss of principal. Past market performance is not indicative of future results. Guardant Wealth Advisors, LLC is a registered investment adviser. Registration does not imply a certain level of skill or training.
more posts:
Weekly Market Commentary: November 2 – 6, 2026
Weekly Market Commentary: October 26 – 30, 2026
Weekly Market Commentary: October 19 – 23, 2026